

👋 I'm
Drew Koontz
I love Business Intelligence, designing dashboards, automating messy workflows, and solving fun problems with Excel.
This portfolio highlights selected projects and tools I’ve built to turn complexity into clarity.

🎓 MSBA Candidate - UC Irvine
🏅 Top 100 - TikTok Educator Contest
What I Build
A snapshot of the work I build
Analytics
Uncovering trends and insights to support smart decisions
Data Modeling
Building scalable models to keep metrics consistent and reporting accurate
Data Visualization
Turning data into clear, compelling visuals that drive understanding
BI Dashboards
Creating interactive dashboards with defined KPIs, drill-downs, and clean UX
Automation
Streamlining repetitive work with reliable, time-saving workflows
Custom Solutions
Designing tailored tools that solve unique business problems
Dashboards
These examples show my approach to KPI design, data modeling, and visual clarity
(Enterprise dashboards are not shown due to confidentiality)
Power BI - Sales & Margin Performance
KPI-driven reporting for revenue, margin, mix, and trend monitoring
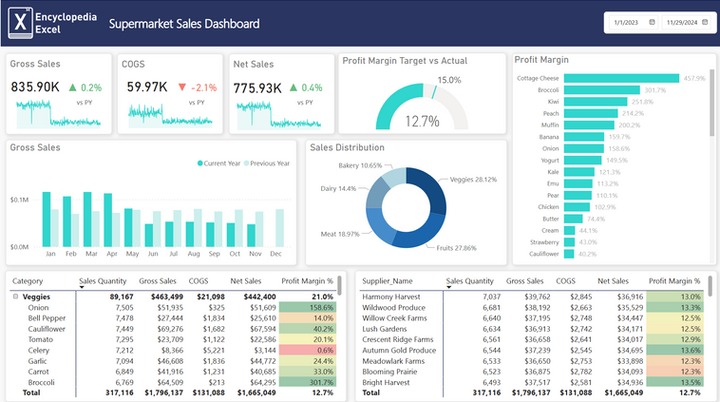
Tableau - Visual Analytics
Interactive analysis focused on trends, rankings, segmentation, and storytelling

Adaptable
Built to evolve with changing metrics, new data, and shifting priorities
Trusted
Used regularly by frontline teams and executive leadership
Operational
Embedded into day-to-day decisions

How I Work
The stack behind the projects on this page
Business Intelligence
Power BI
DAX
Tableau
Data modeling, insights, and reporting
Process Automation

UiPath
VBA
Automating repeatable tasks with reliable workflows
ETL & Data Prep

Power Query
Alteryx
SQL
Automating and transforming raw data
ERP & Enterprise Systems
Microsoft 365
SAP
Operating within the corporate data ecosystem
Excel Based Projects
Projects created entirely within Excel, pushing the program to its limits
Fractal Generator

Built a formula-driven Mandelbrot set visualizer entirely in Excel, using custom logic and conditional formatting to generate fractals with dynamic zoom and color mapping.
Custom Functions

Used Excel Labs to develop bespoke LAMBDA-powered functions, streamlining complex tasks and empowering users with reusable, intuitive custom logic directly in their spreadsheets.
Warehouse Inventory Tracker
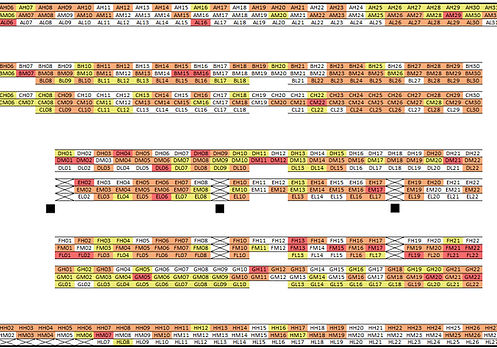
Designed a live-updating inventory heatmap to display warehouse utilization by zone, enabling real-time decision-making around space planning and stock movement.
Monte Carlo Simulations

Integrated Python within Excel to simulate thousands of potential stock price outcomes using Monte Carlo logic, helping visualize volatility and forecast risk over time.
3D Projections

Rendered and animated a rotating 3D cube in Excel by plotting eight points, applying rotational matrices, and using VBA to bring interactivity and motion to the charted points.
Calendar Win/Loss Heatmap
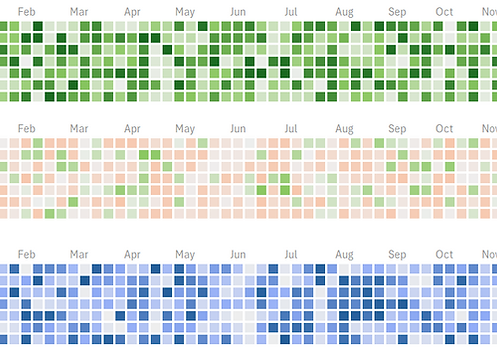
Created a GitHub-style calendar heat map in Excel to track daily progress across months, blending conditional formatting with date logic for an intuitive visual tracker.
Credentials


Corporate Finance Institute
Microsoft
Business Intelligence & Data Analyst (BIDA)
PL-300 Power BI Data Analyst
Work Experience
6+ years of experience in corporate finance, analytics, and data transformation

Encyclopedia-Excel
Creating tutorials covering all levels of Excel, VBA, and Power BI, reaching 200k followers and 15+ million combined views

Alteryx
Designer Core Certified


